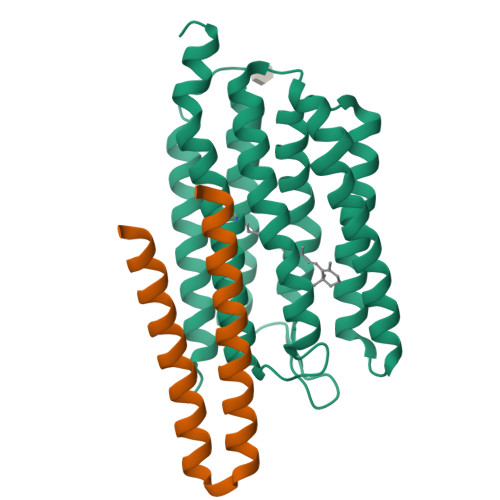
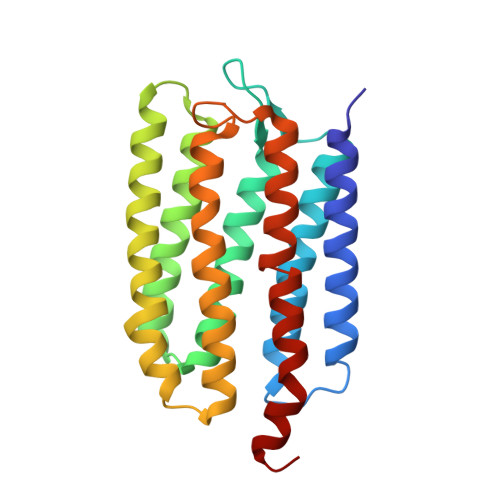
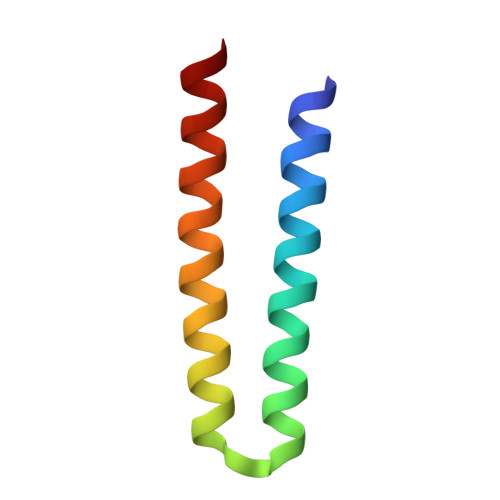
Molecular Basis of Transmembrane Signalling by Sensory Rhodopsin II-Transducer Complex
Gordeliy, V.I., Labahn, J., Moukhametzianov, R., Efremov, R., Granzin, J., Schlesinger, R., Bueldt, G., Savopol, T., Scheidig, A., Klare, J.P., Engelhard, M.(2002) Nature 419: 484
- PubMed: 12368857
- DOI: https://doi.org/10.1038/nature01109
- Primary Citation of Related Structures:
1H2S - PubMed Abstract:
Microbial rhodopsins, which constitute a family of seven-helix membrane proteins with retinal as a prosthetic group, are distributed throughout the Bacteria, Archaea and Eukaryota. This family of photoactive proteins uses a common structural design for two distinct functions: light-driven ion transport and phototaxis. The sensors activate a signal transduction chain similar to that of the two-component system of eubacterial chemotaxis. The link between the photoreceptor and the following cytoplasmic signal cascade is formed by a transducer molecule that binds tightly and specifically to its cognate receptor by means of two transmembrane helices (TM1 and TM2). It is thought that light excitation of sensory rhodopsin II from Natronobacterium pharaonis (SRII) in complex with its transducer (HtrII) induces an outward movement of its helix F (ref. 6), which in turn triggers a rotation of TM2 (ref. 7). It is unclear how this TM2 transition is converted into a cellular signal. Here we present the X-ray structure of the complex between N. pharaonis SRII and the receptor-binding domain of HtrII at 1.94 A resolution, which provides an atomic picture of the first signal transduction step. Our results provide evidence for a common mechanism for this process in phototaxis and chemotaxis.
Organizational Affiliation:
Research Centre Jülich, Institute of Structural Biology (IBI-2), 52425 Jülich, Germany.